Dear People Who Like to Share Wrong Information:
In the age of social media, I know it is hard not to share a chart or a meme that fits in with your world view/personal bias. I know it seems great in the moment, but I really encourage you to check your facts.
As we are in an election year, and people are foaming at the mouth, sharing misinformation is a real problem.
A couple of far-right friends shared a chart I found interesting:
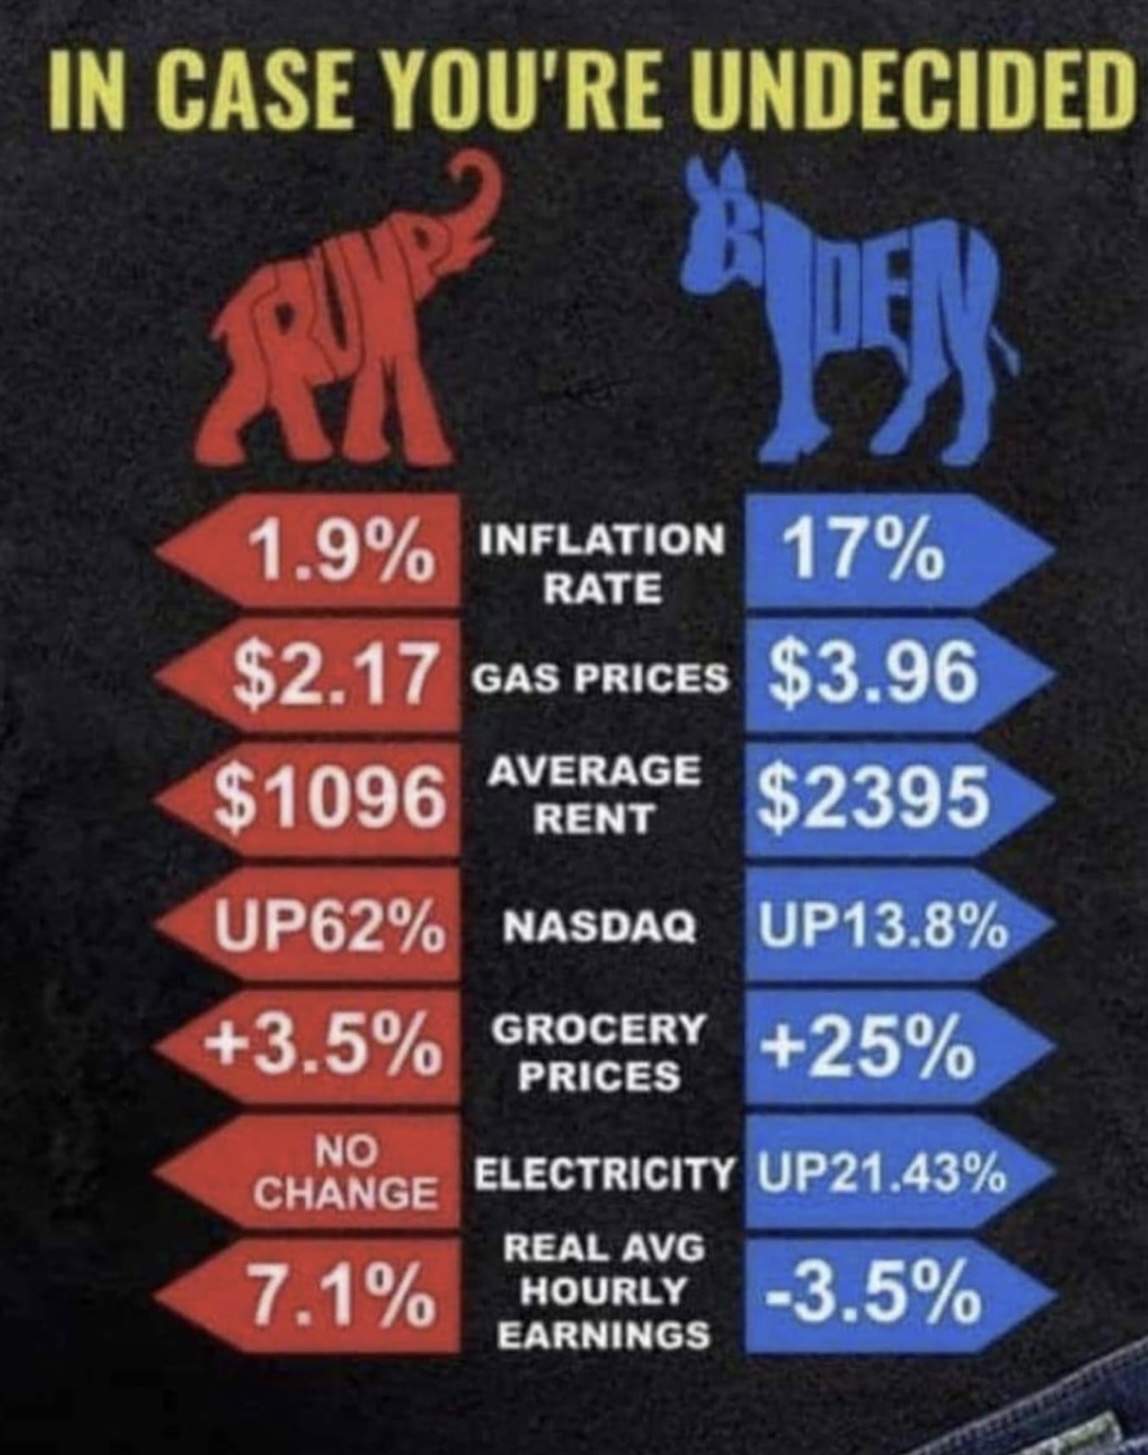
It’s interesting to me because it looks great for your cause if you are a Trump supporter.
(Quick personal bias check: I am a Never Trumper. I’m sure most of y’all know that.)
BUT THIS CHART IS WRONG. I know it is wrong because I had recently done some research on gas prices.
(That people think the President of the United States controls the price of gas is insane to me.)
Anyway, I was motivated to get the real numbers, and I had some spare time.
I put together a spreadsheet. I hate Excel, so I need everyone to understand that this is a big deal.
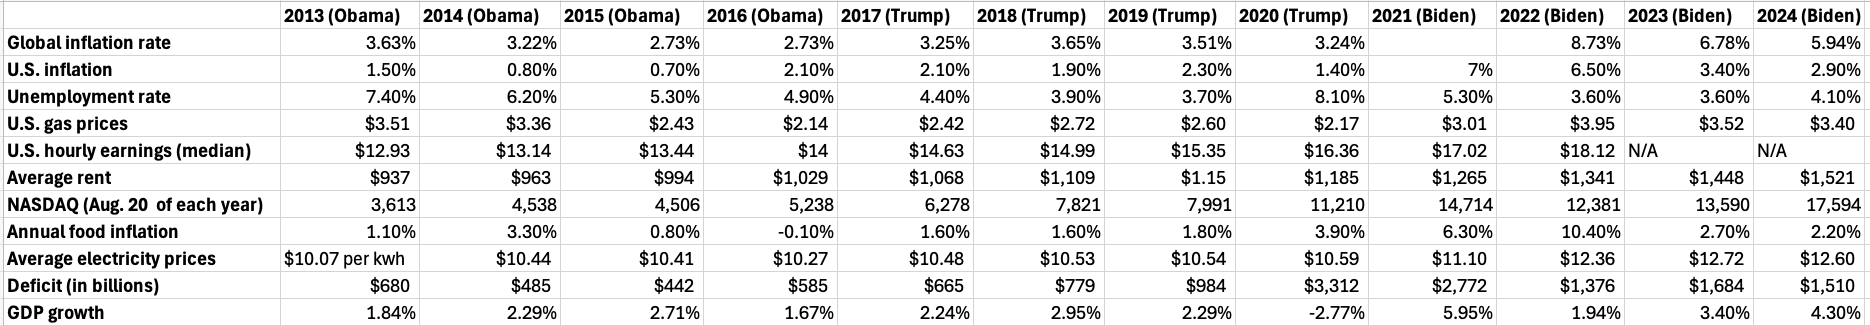
In addition to providing the real data for the categories in the chart above, I added some other key info such as the global inflation rate, deficit and GDP. I also added the numbers for the last four years Obama was in office to give context.
I’m presenting it here without comment. These are real numbers, and I can provide sources for this data (non-media sources). Let me know if you want me to send you the spreadsheet with source links.
The bottom line: Educate yourself. Decide what is important to you. Vote accordingly.
Also, don’t share stupid inflammatory shit that is wrong. There is enough misinformation in the world without you adding to it.
Kthxbyeeee,
Beth